 |
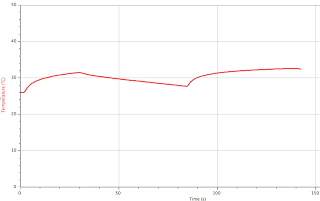
| This graph shows how the temperature changed with the different intervals of jumping jacks |
Just recently we started learning about homeostasis. Homeostasis is the ability to remain stable. My group and I decided to do jumping jacks to test our temperature and how quickly it would rise. After ten jumping jacks the temperature of Tenchita's body began to rise. She had a three minute rest to let her body cool down, making the temperature drop about four degrees. After she was rested, she did 25 jumping jacks. After 25 jumping jacks her temperature rose from 27 degrees to almost 33 degrees. This represented that the more jumping jacks or more activity you do, the higher your temperature increases. Homeostasis was exemplified in this lab due to the fact that it showed how the body heats up, but also cools itself down when relaxation takes place.
The graph below shows what her temperature started out as then as it progressed with 10 jumping jacks, cooled while at rest and then shot back up after 25 jumping jacks.
In order to complete this experiment on your own, you could follow these few simple steps (=
Materials Needed
- Thermometer
- Person capable of doing jumping jacks
- Time
First you would go to a room temperature area so that it wouldn't affect the temperature change. Next you would take the temperature of the participant that is going to be doing the jumping jacks. Write how high the temperature is on a piece of paper. Then have the participant do 10 jumping jacks approximately for 25 seconds. After they complete that task, take the temp. right away. Write that number down. Next step is to take the temperature of the person's body after they rest for about five minutes. After that temperature is taken have the participant do 25 jumping jacks for approximately 25 seconds. After all of this is completed, graph the numbers and see how much the numbers changed from doing 10 jumping jacks to 25 in the same time interval.

No comments:
Post a Comment